Animated visualisation: eight hundred and sixty-seven building footprints of Zürich's old town rise from a ground grid in turn, each flashing amber at the moment it is predicted, shaded by height.
Urban fabric prediction
Forty years of growth predicts the future
Through three projects co-developed with the German Aerospace Centre: the Global Urban Footprint, the World Settlement Footprint (WSF) and WSF Tracker, we have assembled one of the most complete accounts of urban development on the planet.
Using this, combined with building information and other spatial signals, we can model how the built environment changes and predict where growth is most likely to happen next. Our forecast can then be combined with population, mobility, infrastructure and hazard models to understand what that growth means for the wider urban system.
Every building, with a height and a purpose
We start from the building inventories a city already has, fill the gaps using the best global databases, and extract the rest from satellite imagery. Every building then takes a height from our own height layer and a use from a model trained on that particular city.
The model reads each building's shape and height, the streets around it and the way its neighbours are arranged, then determines whether it is a house, a shop, a factory, a school, a warehouse or something else, along with how sure it is. We have run this across Juba, Kigali and Johannesburg: 3.7 million buildings between them.
What comes next
Predicting growth, a year at a time.
For each year of our forecast, we produce a map of where new settlements are likely to appear. Our model learns where development goes from the settlement record, then decides how much to expect and places it, following the shape the city already has.
What we’ve discovered is that growth is pretty rare. In most cities, between 0.15% and 1.05% of the open land around a city gets built on in a given year. The fastest developing places in the world are only adding about 4% per year.
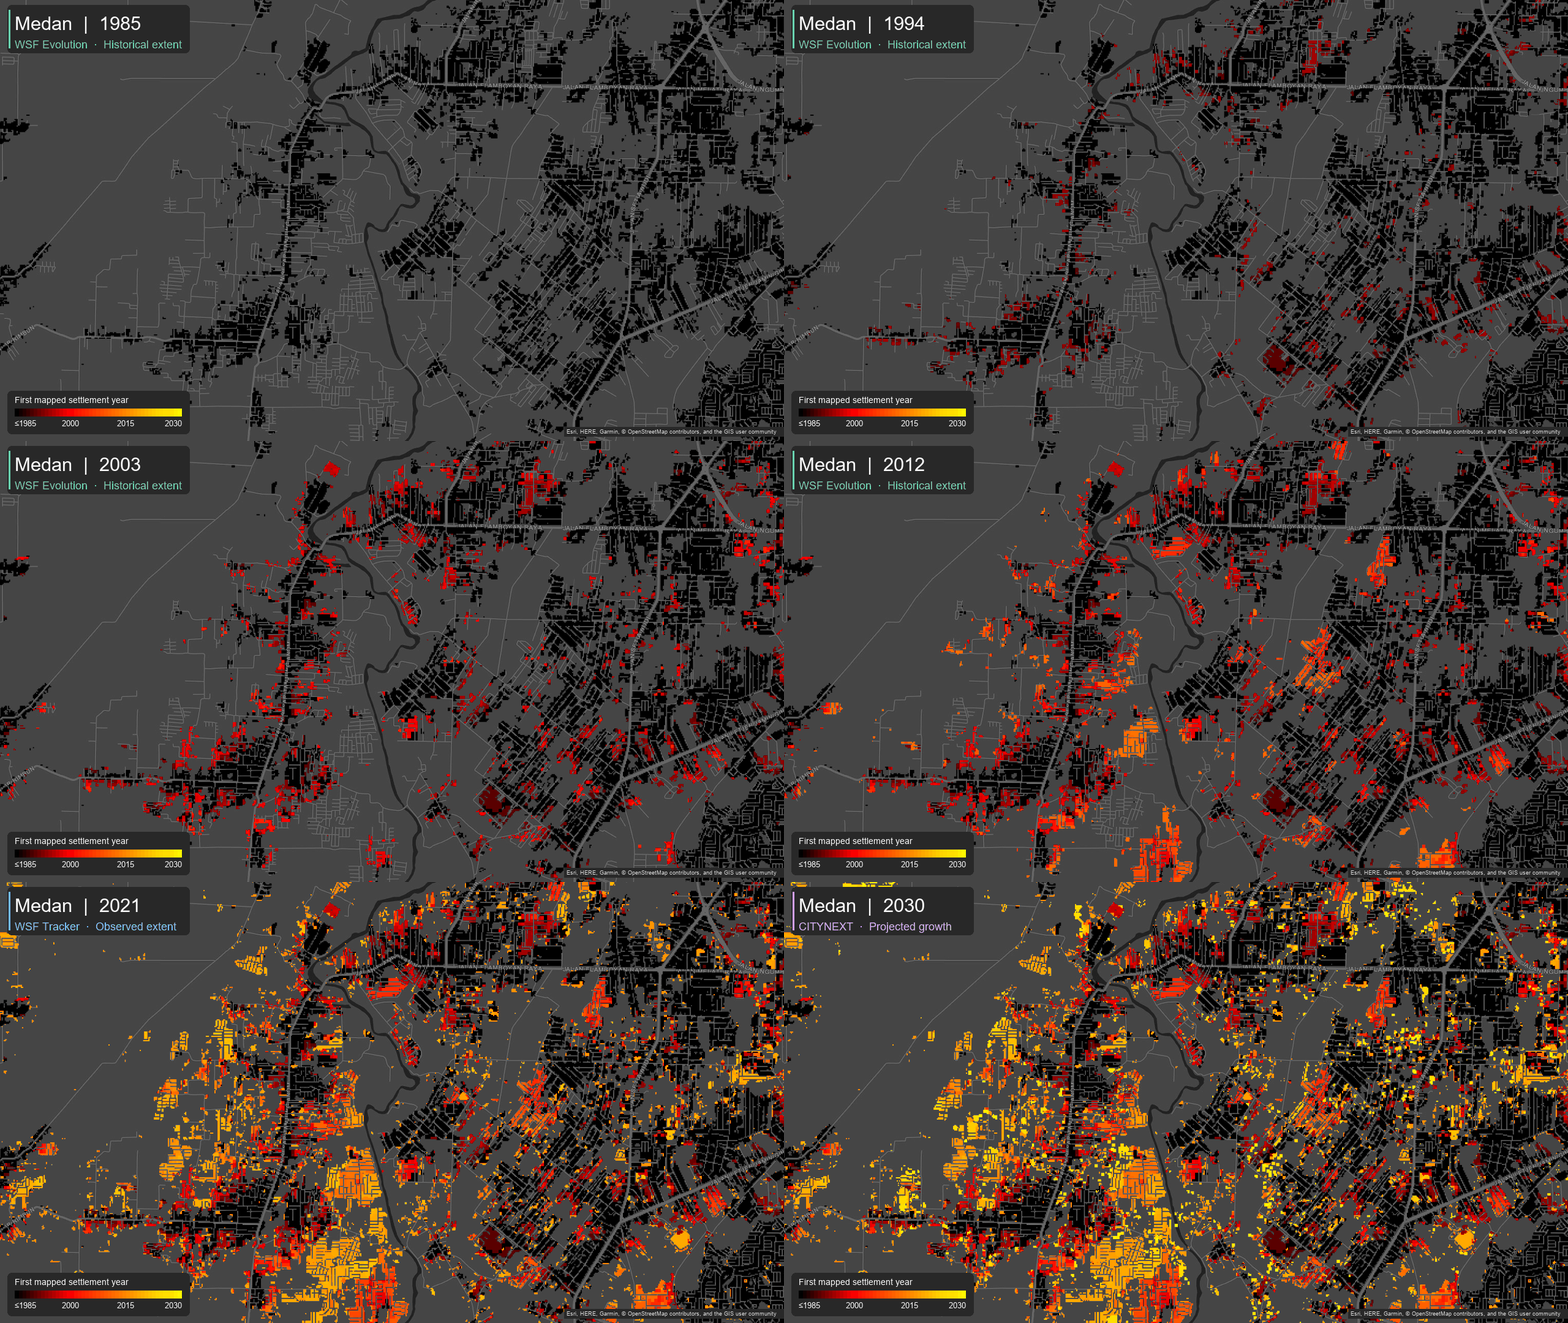
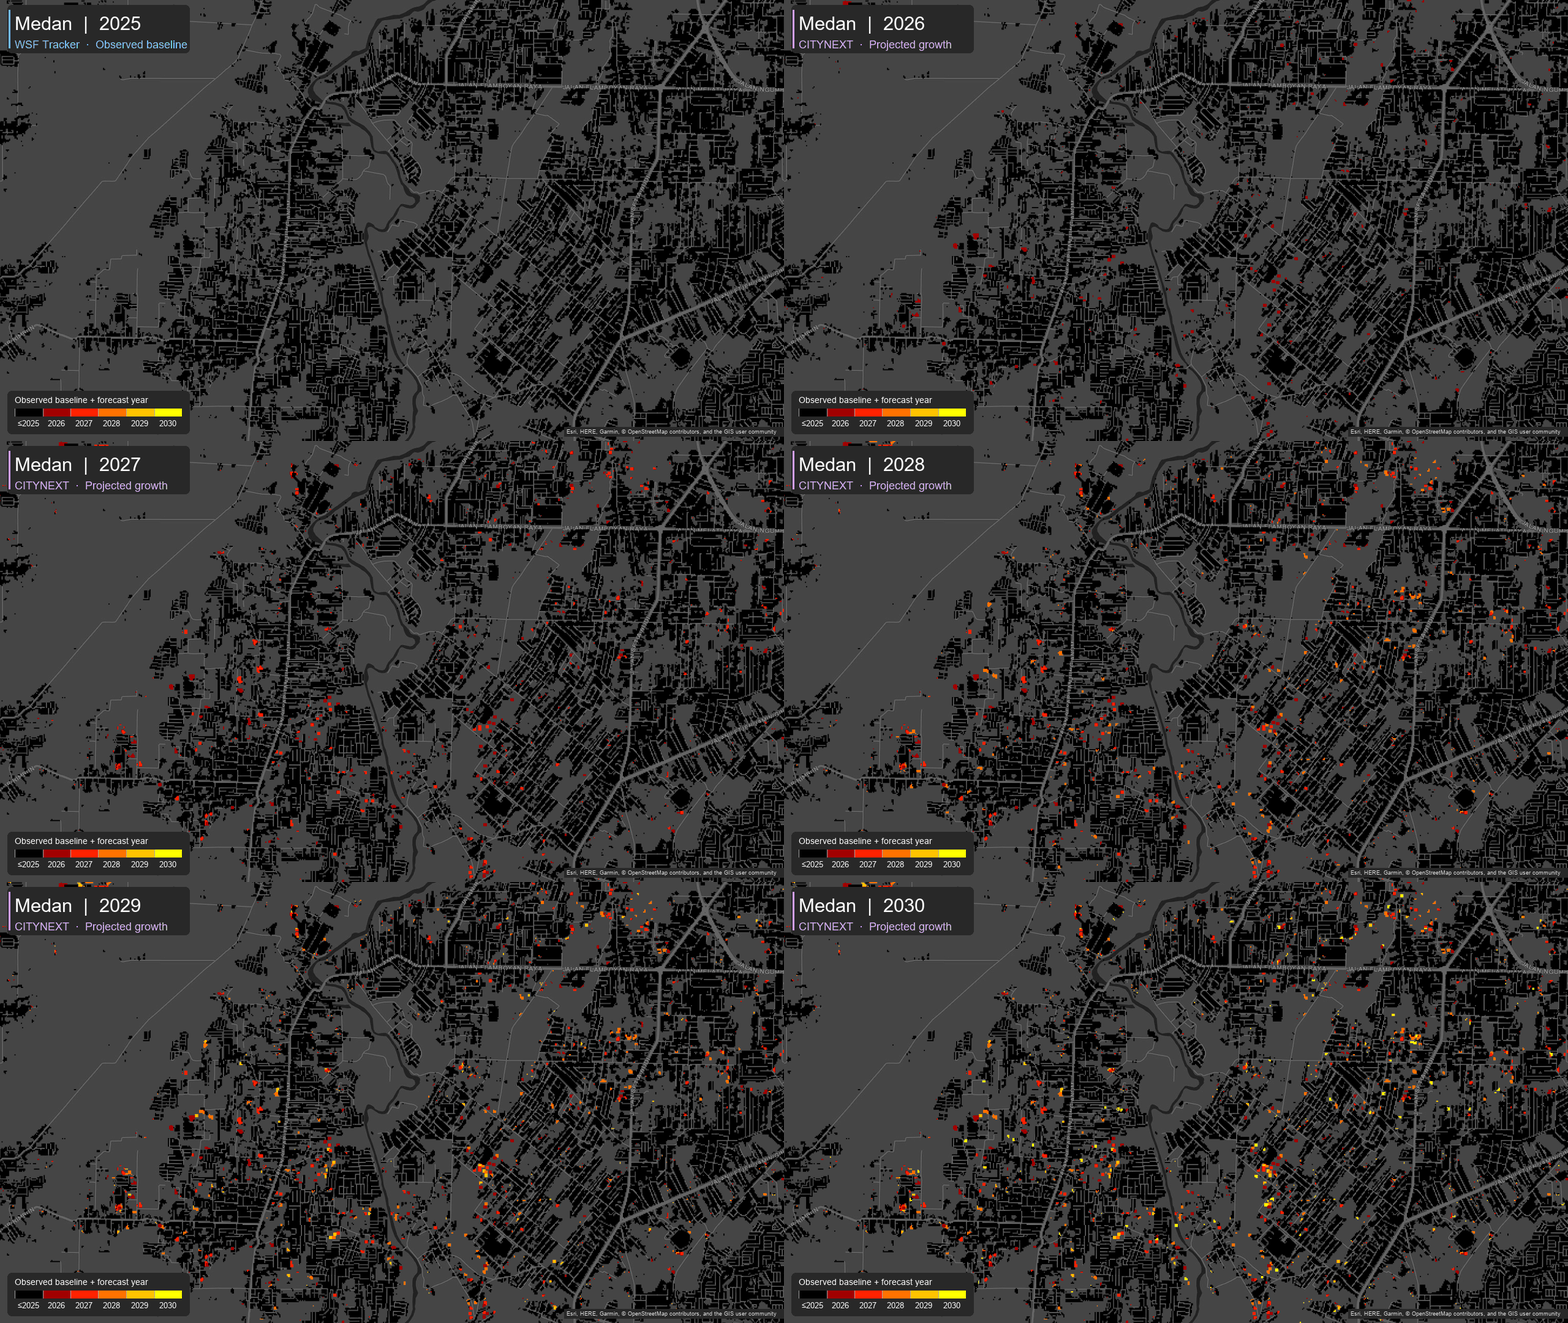
We also found that growth in a city tends to follow the same patterns over time. Warsaw densifies in blocks and along its existing edges, Johannesburg combines peripheral expansion with infill and scattered leapfrog development, and Medan fills in around the fragments of its peri-urban fabric.
See how cities grow
Compare observed building growth with predicted future development using the demo. The map shows buildings detected from Earth Observation data alongside areas where new buildings are predicted.
Interact with the model and explore how an urban area could grow over time.
Bring us a city you already know well
Name a city you know well, and we’ll show you what our model predicts for it. Check it against whatever you already know.